
This is the first in a series of blog posts about how great SQL Server 2016 is, and why you should all want to upgrade your applications to this platform.
I’ll be honest with you, I’m not usually a person to be bothered about new versions, about being up there at the bleeding edge. I’m happy and comfortable in my old tools – like a well worn sofa and pair of slippers.
In my head I still don’t really see anything wrong with SQL Server 7 (which was the first version I used in anger). Although to be fair, if you make me go back as far as SQL 2000 now, I do start to realise how much we were missing back then. If you ask me what was my favourite new feature in SQL 2014 though, I might have to rack my brain a bit – were there any useful new features in 2014? I know hardly anyone adopted it.
SQL Server 2016 however has a number of features I’m (dare I say it) quite excited about. The sort of things where you go – oh wow, that is seriously going to make my life easier. And that’s what we all want isn’t it? An easier life. 2016 is probably the most significant release in over 10 years, and the features provided are going to make life easier for DBAs, for developers and also for those responsible for the security of our data.
So enough of the intro, let’s get started, in today’s post we’ll look at what is arguably the coolest new feature…
Live Query Stats
Rather than try and explain what this is, in the first instance it’s probably easier just to show you.
I’m going to create an arbitrary query that takes a little while to run. Here it is:
--Don't do stuff like this:

SELECT count_big(*)

FROM

[Purchasing].[PurchaseOrderLines] a,

[Purchasing].[PurchaseOrderLines] b,

[Purchasing].[PurchaseOrderLines] c
You can turn on Live Query stats through the toolbar in SSMS (the button is next to the one for including the Actual Execution Plan), or right click over your query window and select it from the menu:

Then when you run your query, you’re going to see something like this:

I’ve only shown you part of the execution plan so you can see clearly what is going on. You’ll see it basically shows you the progress of each of the operators in your execution plan.
If your brain works like mine, you’ll immediately think of all those times when you’re waiting for a query to finish and wondering if you should wait or just kill it, and you’re thinking – “This is great, this will tell me how long my query has left to run!”
Then you’ll go “Oh hang on, I have to have turned live query stats on before I run my query if I want to see this info. Maybe not that useful after all.”
That was literally what I thought when I first encountered this, but then I found you could connect to (potentially) any currently running query. Production DBAs are going to love that part of it, being able to check out long running queries and see from the level of progress whether it’s worth killing them, or not.
One way you can do that is through the Activity Monitor (right-click on your SQL Instance in SSMS and select from the menu). You can probably find the query you’re interested in under “Active Expensive Queries”:
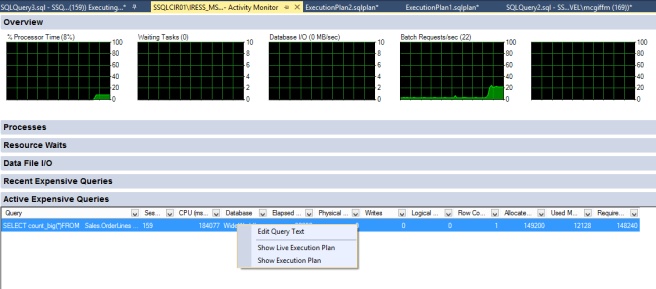
You can right-click over the query and select “Show Live Execution Plan” from the menu.
There is a Caveat though for this, which is that you need a particular Trace Flag enabled globally on your instance to enable this. Otherwise the option will be greyed out. The traceflag is 7412 which enables a “lightweight statistics infrastructure which can be used to view the live query statistics from other sessions”.
You can set this flag from any session even once the query you’re interested in is already running, however it will be lost when SQL restarts unless you have set is as a start-up parameter for your SQL Instance:
--Enabling a Global Trace Flag

DBCC traceon(7412,-1);

GO
There are other ways of achieving the same functionality but I think the trace flag is the easiest.
Of course, you may be in a situation where you can’t make such changes as enabling a trace flag. Don’t worry, there is still a way to view the progress for a running query.
All you need is the SessionId for the running query. There’s lots of ways of getting this. In the above example, you can see it in the Activity Monitor, if it’s your own query then it’s shown at the bottom of your query window in SSMS.Once you have the Id then you can just run this query:
--Get the execution plan and current progress for session 159

SELECT *

FROM sys.dm_exec_query_statistics_xml(159);
That will give you output like this:
![]()
Simply click on the query plan XML and you can see the actual plan being executed. Within the properties for each operator you can see “Actual Number of Rows” which tells you how many rows have been processed so far. You can compare this to the Estimated Number of Rows to get an idea of progress – as long as the Estimates are accurate!

It’s not animated, and doesn’t update, but does give a current snapshot which is all you generally need.
So, as seen, SQL 2016 offers you the ability to look at live queries and see what’s going on in more detail, in particular to be able to assess the progress which is something you couldn’t do before. Plus the animated view is a bit cool. I think this is going to a really useful feature not just for DBAs, but for anyone who has sat looking at the time ticking by while they wait and wonder if their SQL query is ever going to finish.
Performance – Read This!
Nothing comes for free in life and a watched pot never boils.
I anticipate that turning on the traceflag will have negligible affect on performance in general as the base functionality is enabled anyway – as can be seen by the data being accessible through the sys.dm_exec_query_statistics_xml DMV. It is also implemented using Extended Events which have been shown to have minimal overhead compared to profiler traces. Only testing with a workload can prove this though and I haven’t been able to undertake that activity.
Watching an individual query via the animated Live Query Statistics view however does seem to have a high overhead, and it’s also already known that turning on the generation of Actual Execution Plans in itself has an overhead. I did some basic testing with a reasonably long running query that took about 150 seconds to complete without this turned on and then compared the results. In this case, a watched pot took significantly longer to boil. The results were reasonably consistent over a series or runs. With Live Query Statistics turned on, and watching it in SSMS, the query took approximately 50% longer – about 225 seconds.
This is quite disappointing but doesn’t mean you shouldn’t use this. The recommendation though, would be that if you are using this to check the progress of a query in production, check the Live Query Stats to see how it’s progressing, and then close them again so the query can continue without the additional overhead. Also consider using the DMV instead. I imagine there will be some overhead in calling the DMV, but that is a one off operation rather then the ongoing polling that the animated view uses.
One thing to note is that this sort of usage is not the only point to the Live Query Statistics. They can also be very useful for a quick visual way of verifying where your query is getting bogged down, as well as a helpful tool for understanding the flow of data.